
Araks
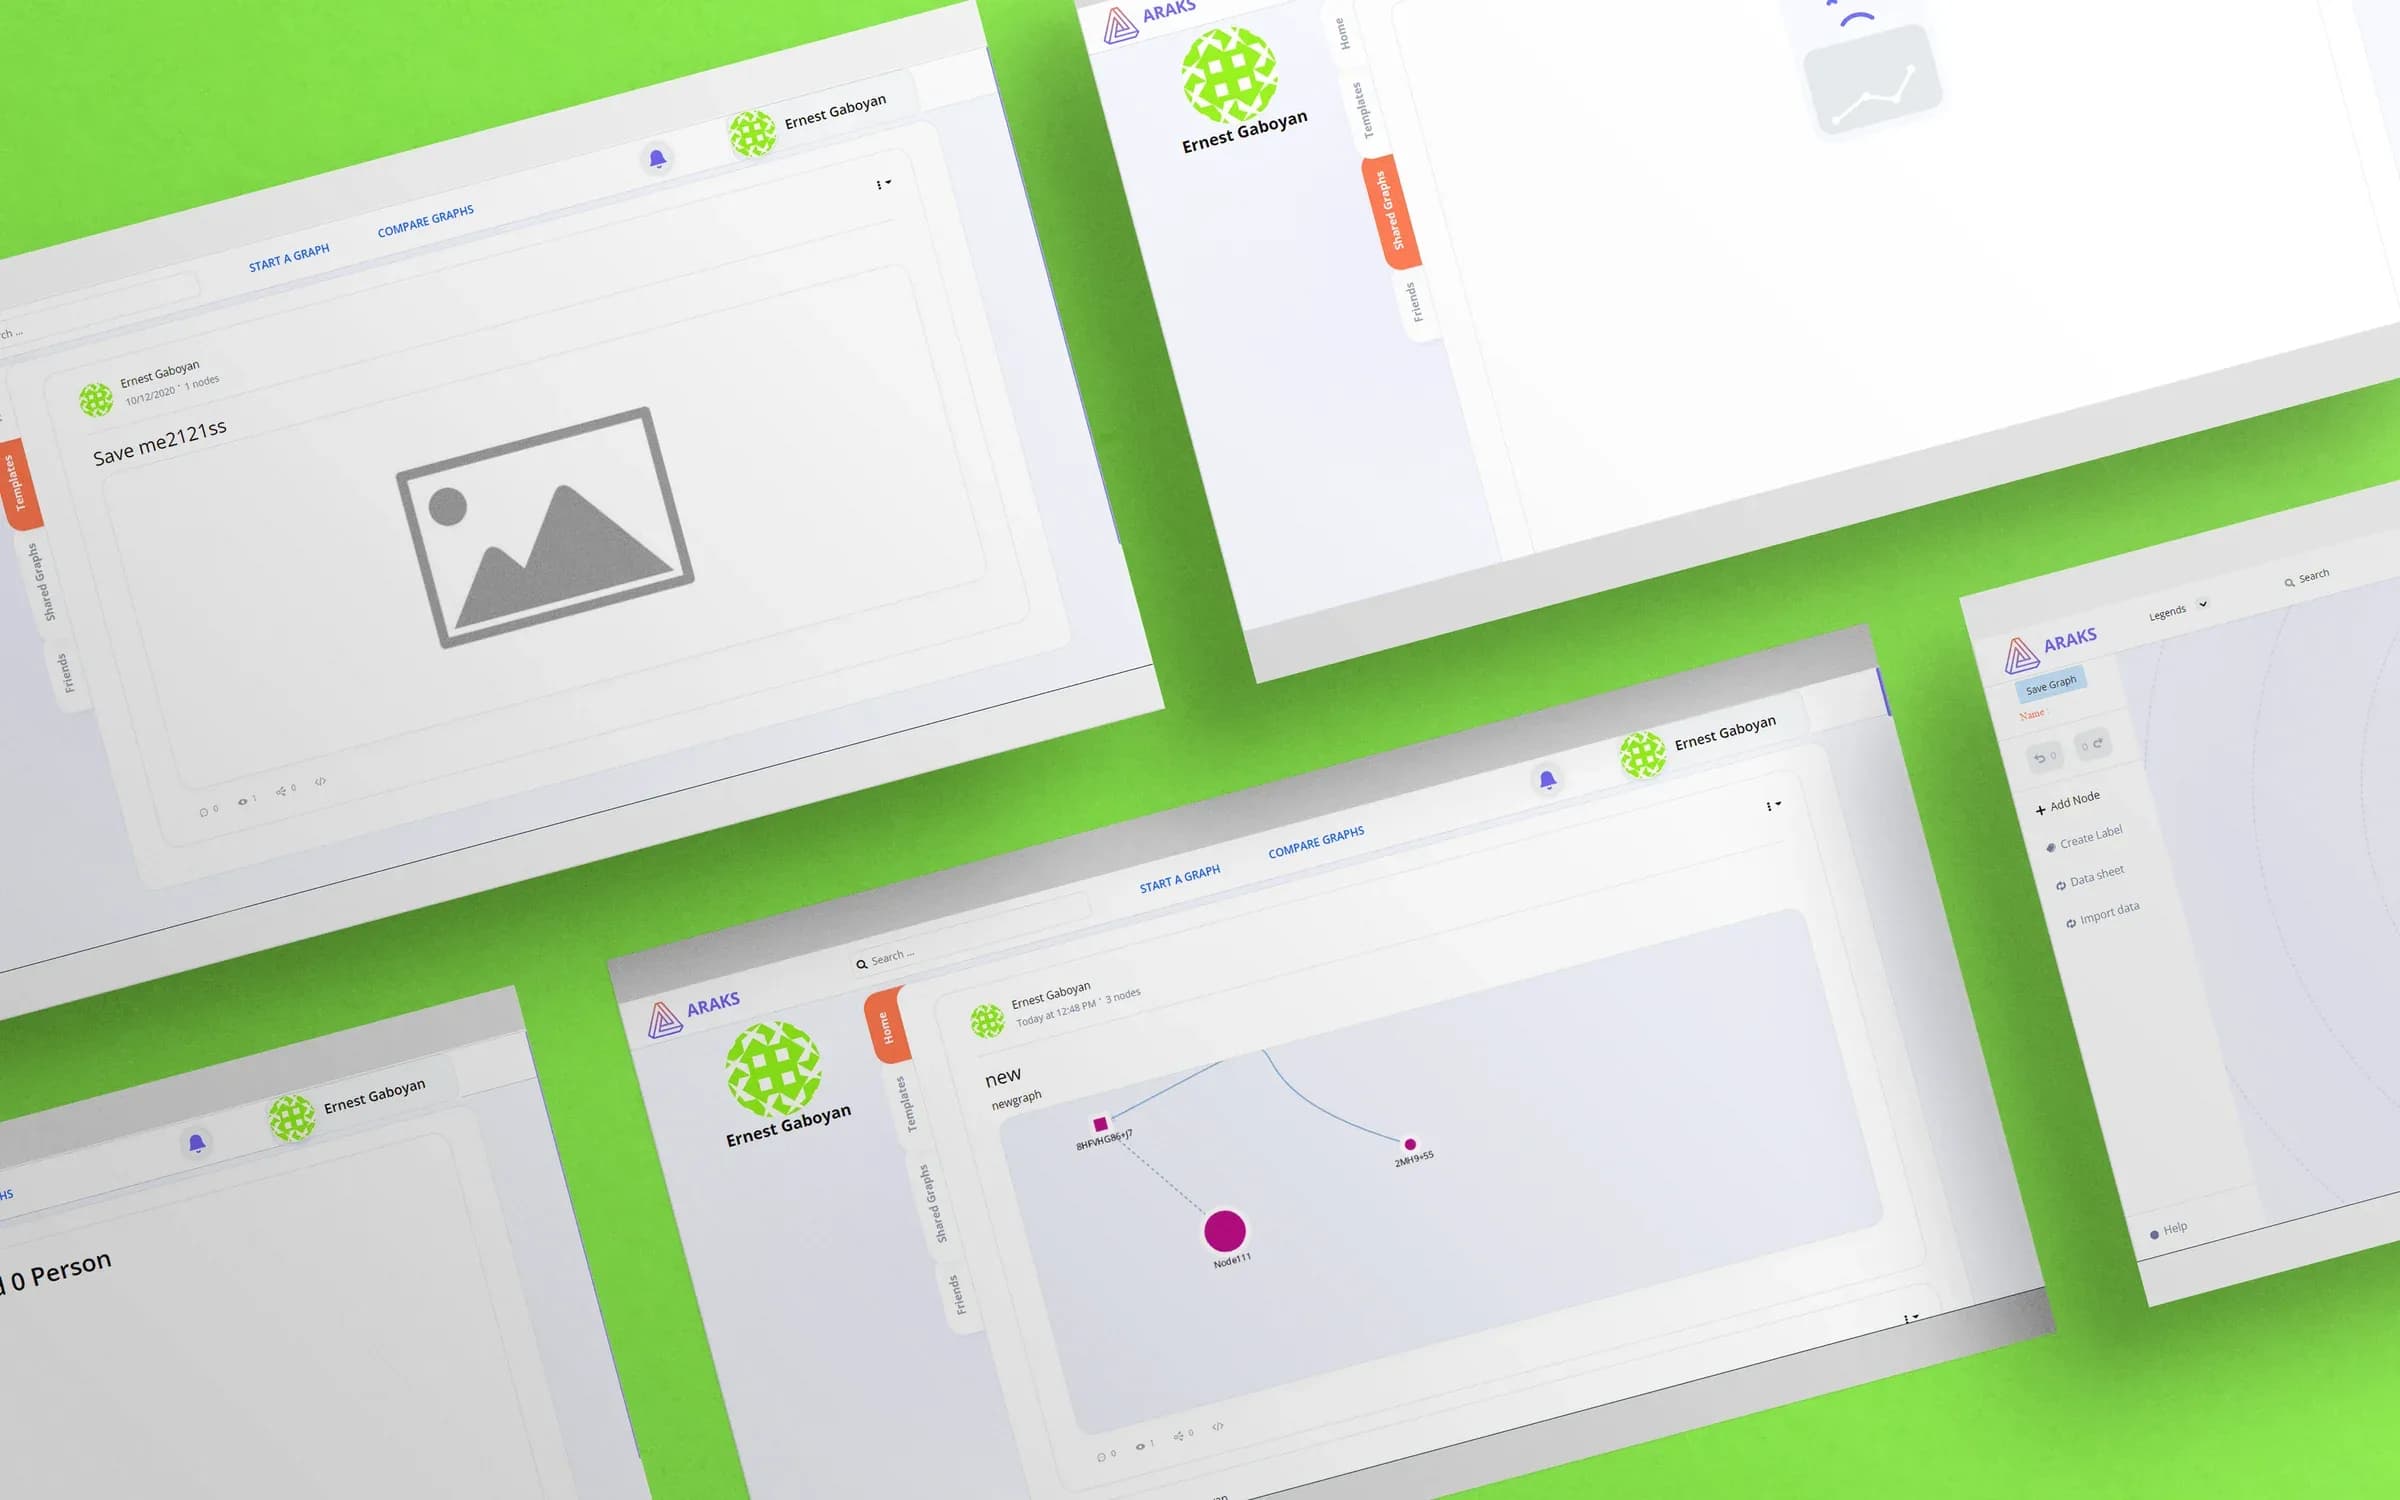
A free graphing tool for mapping, comparing and publishing data networks that turns researchers’ data into interactive, shareable maps.
Client
The clients are mathematicians who do a lot of research in their field.
Business needs
While working together on a research project, the clients realized that one tool to collect and visualize data would make researchers’ lives much easier. Such a tool is useful for civic data research, business, journalism, creative research and organizational analysis. The idea: an ultimate graphing tool that organizes your data in one map.
Our solution
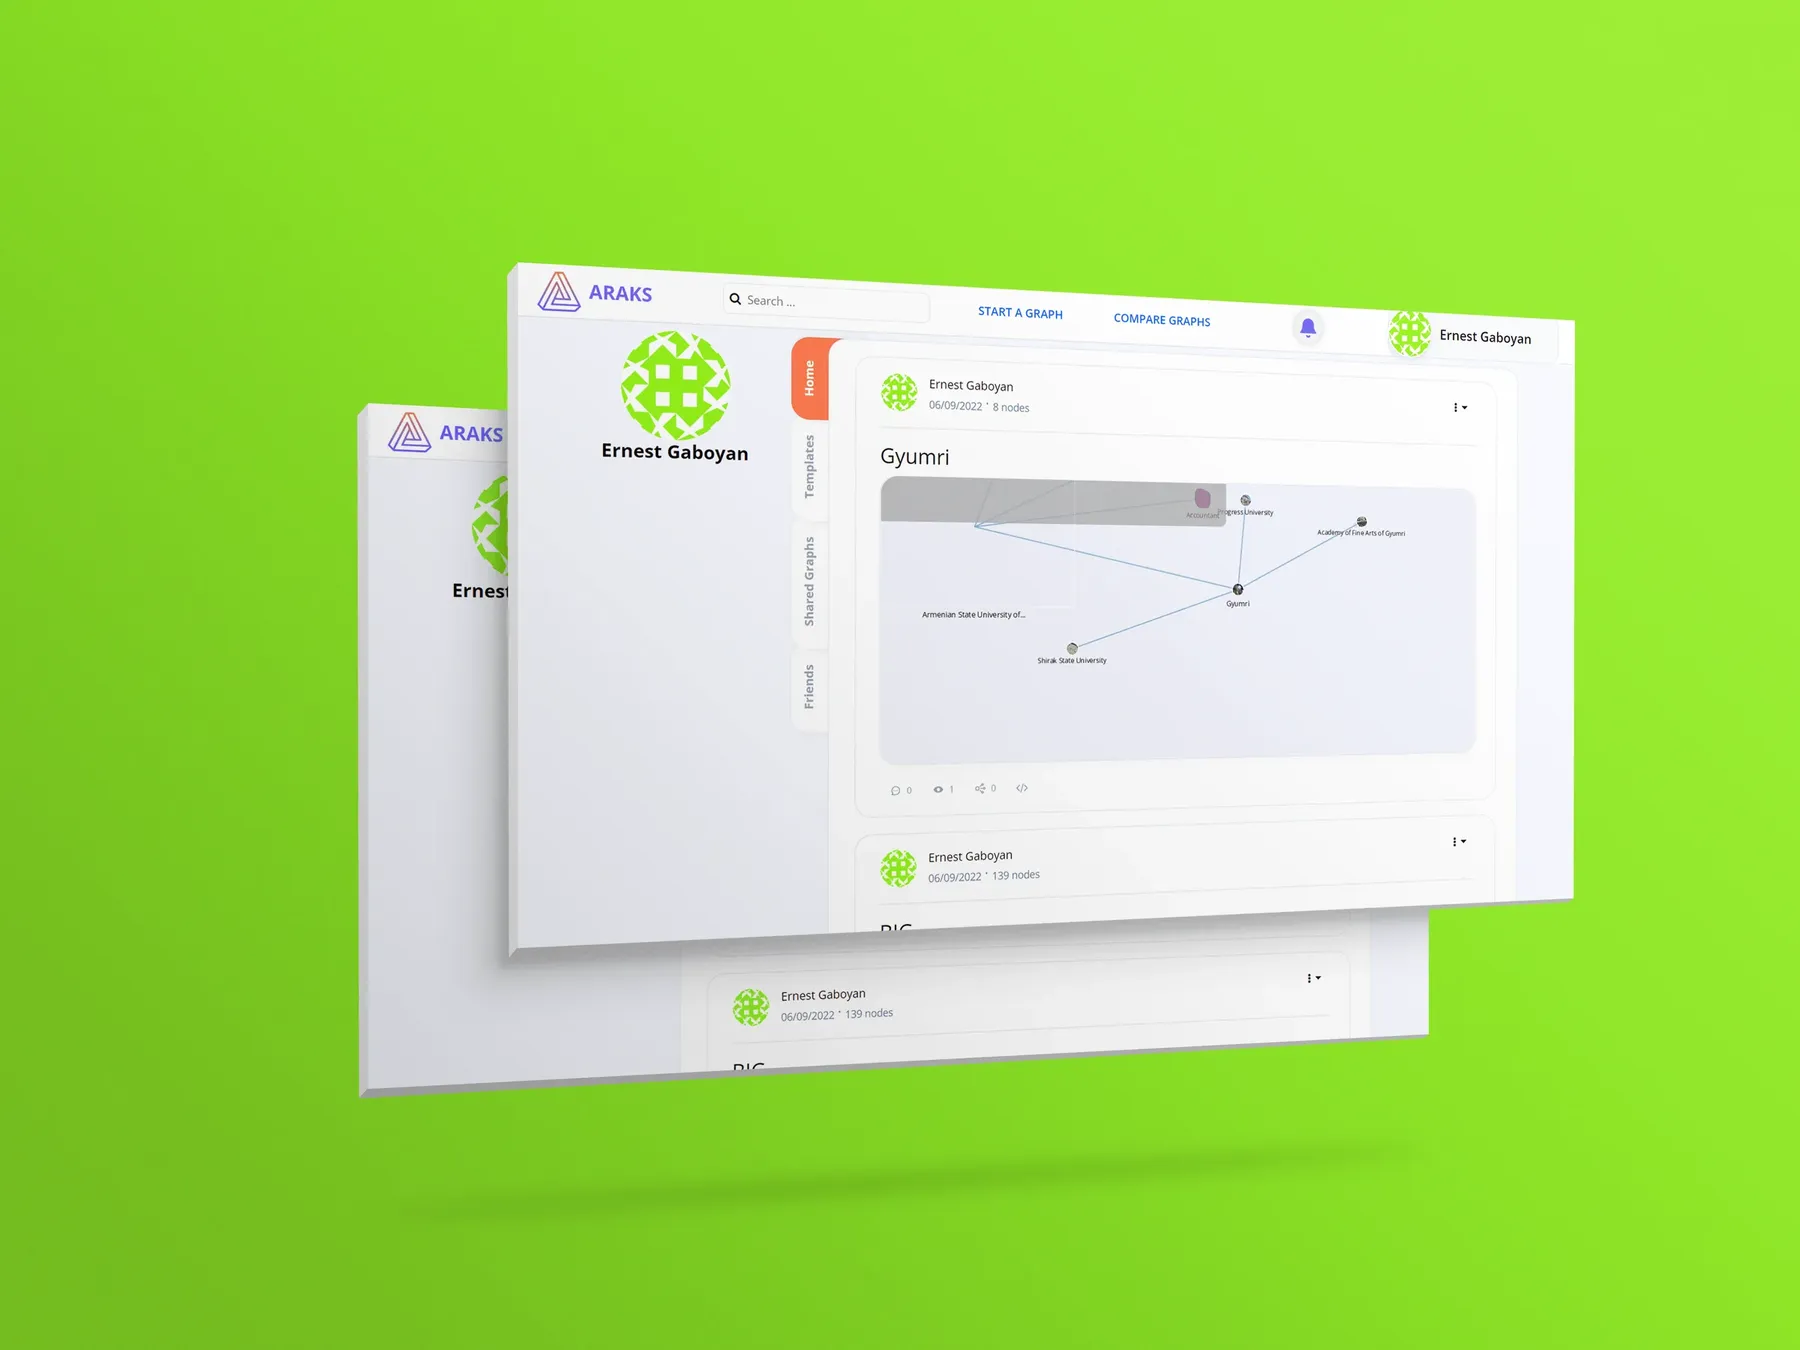
gHost Services developed a tool for mapping, comparing and publishing data networks. Organizations and individuals transform their data into interactive maps and visualize it.
How it works
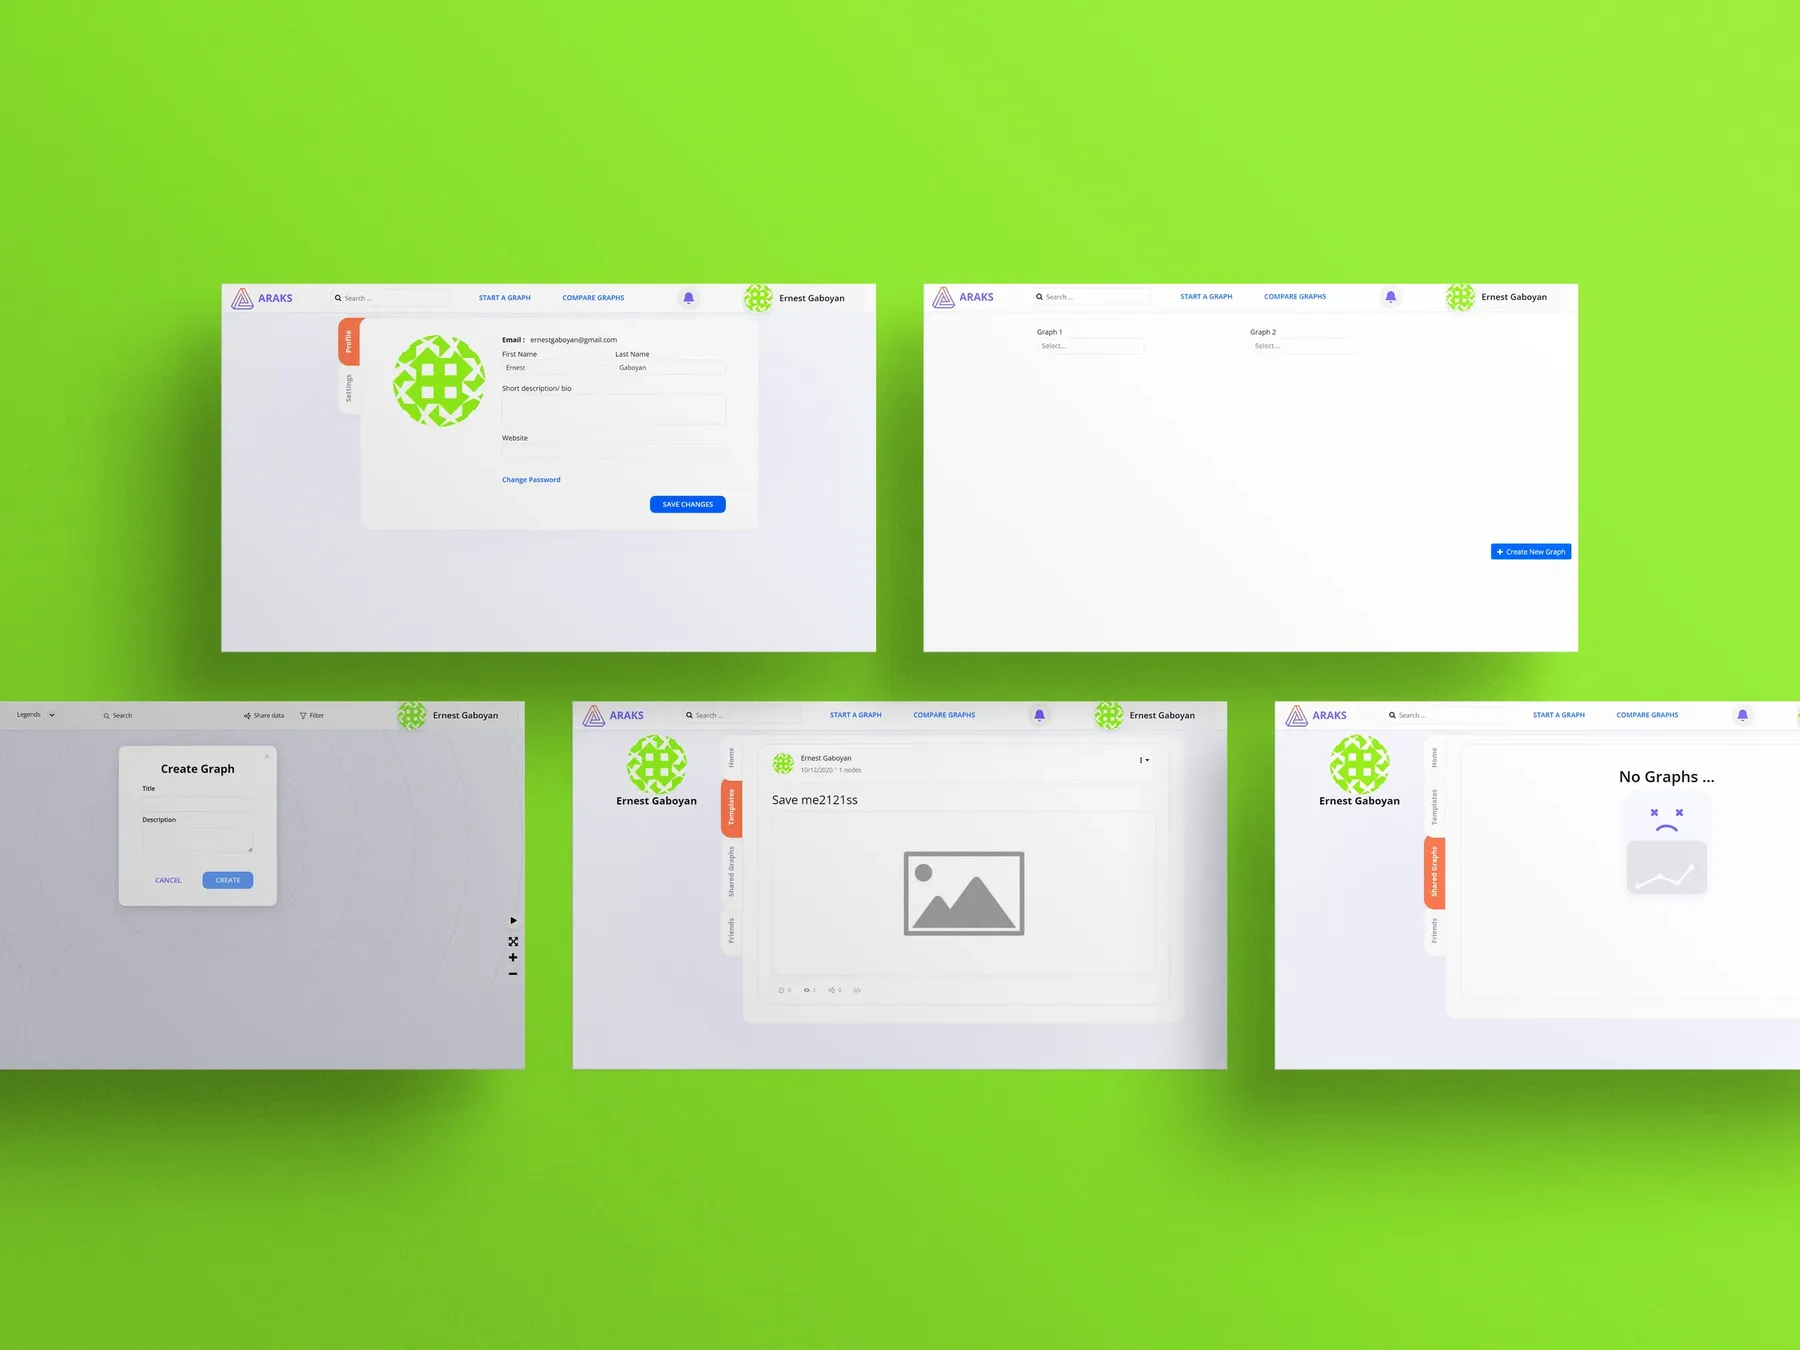
After registering, anyone can use the Araks graphing tool for free. Users build their own network maps, share them, compare them with others, collaborate around data and explore maps on other topics.
Key features
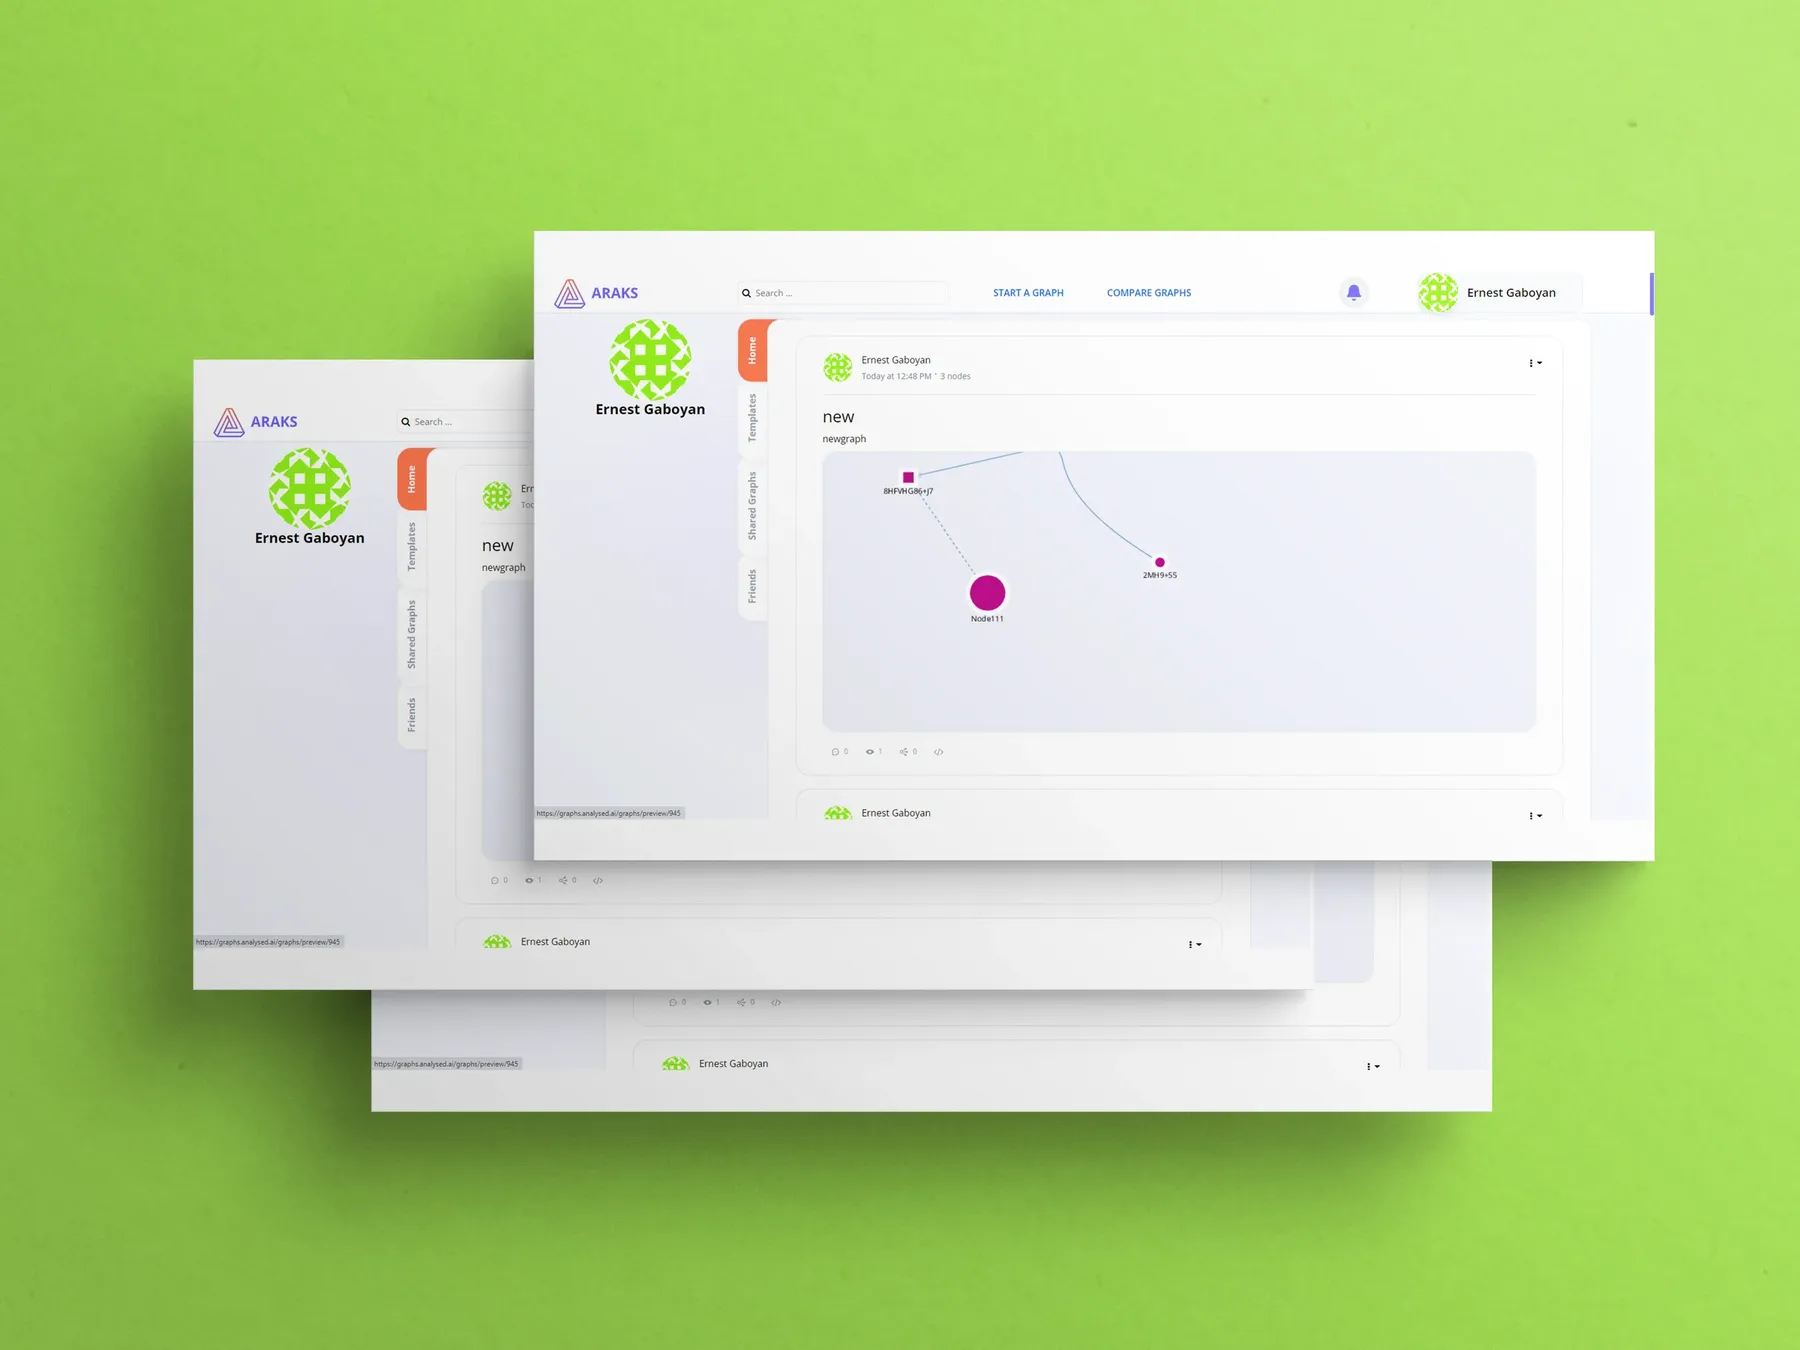
- Mapping, publishing and visualizing data
- Search for ready-made maps on topics of interest
- View, comment on and share visualized data
- Compare two graphs
Challenges
- Uninterrupted work while importing large Excel files and visualizing data
- Mathematical calculations for complex graphs
- Drawing graphs with non-standard shapes
- Real-time collaboration on shared maps
- Creating nodes from Google Maps and Wikipedia
- Showing real-time connections from Google Maps
Results
Technologies
 Google Maps